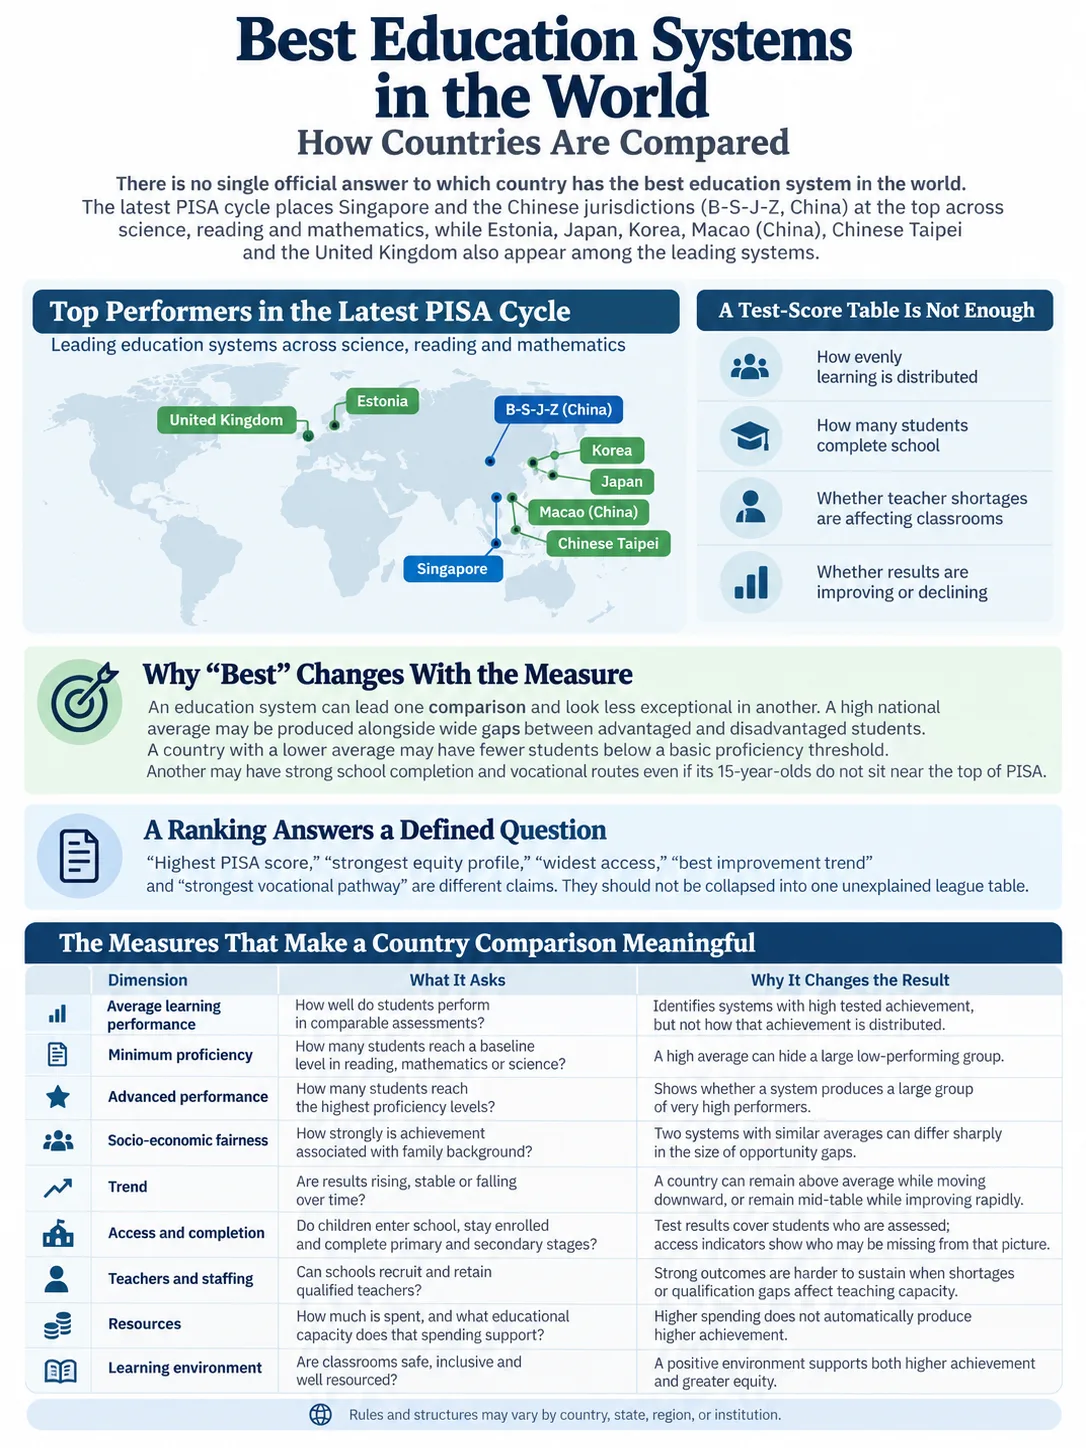
There is no single official answer to which country has the best education system in the world. The latest PISA cycle places Singapore and the participating Chinese jurisdictions grouped as B-S-J-Z (China) at the top across science, reading and mathematics, while Estonia, Japan, Korea, Macao (China), Chinese Taipei and the United Kingdom also appear among the leading systems across all three subjects. Yet a test-score table cannot show, by itself, how evenly learning is distributed, how many students complete school, whether teacher shortages are affecting classrooms, or whether results are improving or declining. A useful comparison therefore starts with performance, then tests that result against equity, minimum proficiency, access, system capacity and trend. [a]
Why “Best” Changes With the Measure
An education system can lead one comparison and look less exceptional in another. A high national average may be produced alongside wide gaps between advantaged and disadvantaged students. A country with a lower average may have fewer students below a basic proficiency threshold. Another may have strong school completion and vocational routes even if its 15-year-olds do not sit near the top of PISA.
This is why “best” needs a defined outcome. If the question is which system currently produces the highest tested academic performance among 15-year-olds, PISA provides a direct comparison. If the question is which system combines strong learning with smaller socio-economic gaps, equity data must enter the comparison. If the question concerns access, completion, teachers, finance or progression into work and higher education, a PISA score is not enough.
A ranking answers a defined question
“Highest PISA score,” “strongest equity profile,” “widest access,” “best improvement trend” and “strongest vocational pathway” are different claims. They should not be collapsed into one unexplained league table.
The Measures That Make a Country Comparison Meaningful
| Dimension | What It Asks | Why It Changes the Result |
|---|---|---|
| Average learning performance | How well do students perform in comparable assessments? | Identifies systems with high tested achievement, but not how that achievement is distributed. |
| Minimum proficiency | How many students reach a baseline level in reading, mathematics or science? | A high average can hide a large low-performing group. |
| Advanced performance | How many students reach the highest proficiency levels? | Shows whether a system produces a large group of very high performers. |
| Socio-economic fairness | How strongly is achievement associated with family background? | Two systems with similar averages can differ sharply in the size of opportunity gaps. |
| Trend | Are results rising, stable or falling over time? | A country can remain above average while moving downward, or remain mid-table while improving rapidly. |
| Access and completion | Do children enter school, stay enrolled and complete primary and secondary stages? | Test results cover students who are assessed; access indicators show who may be missing from that picture. |
| Teachers and staffing | Can schools recruit and retain qualified teachers? | Strong outcomes are harder to sustain when shortages or qualification gaps affect teaching capacity. |
| Resources | How much is spent, and what educational capacity does that spending support? | Higher spending does not automatically produce higher achievement. |
| Learning environment | Are classrooms orderly, supportive and reasonably free from bullying and digital distraction? | Student experience can differ even between countries with similar scores. |
| Pathways after compulsory schooling | Can students move into academic, vocational, technical and higher-education routes? | A school system also has to support progression, not only test performance at one age. |
No single column should automatically dominate every comparison. The right emphasis depends on what the reader means by educational quality.
PISA, TIMSS, PIRLS and System Data Measure Different Things
International comparisons are strongest when the assessment is matched to the question. OECD’s PISA compares 15-year-olds and asks how well they can apply knowledge and skills in science, reading and mathematics; the 2025 cycle also reported computational problem solving. It is designed around an age group rather than a single school grade, which helps compare students who have experienced different national school structures. [b]
TIMSS 2023 takes a different approach. It assesses mathematics and science at the fourth and eighth years of formal schooling and connects achievement data with questionnaires from students, parents or guardians, teachers and school administrators. More than 650,000 students took part in the 2023 cycle. TIMSS is especially useful when the question concerns mathematics and science achievement at defined school grades rather than the broader age-based PISA population. [c]
PIRLS 2021 focuses on reading at the primary-school stage. The latest released international cycle presents reading achievement and contextual data from nearly 60 participating countries, making it useful for questions about earlier reading development that PISA cannot answer. [d]
OECD’s 2026 education indicators move beyond student test scores. OECD indicators cover attainment, enrolment, finance, teachers and the organisation of education systems. The 2026 edition gives particular attention to teacher shortages, which makes it valuable when comparing whether systems have the workforce needed to sustain schooling. [e]
For broader global coverage, the UNESCO Institute for Statistics tracks SDG 4 measures including minimum proficiency, completion, out-of-school rates and the years of free and compulsory education guaranteed in law. These indicators answer access and participation questions that international achievement tests were not designed to settle. [f]
What PISA 2025 Shows About Current Academic Leaders
PISA 2025 is the newest large-scale cross-country comparison of 15-year-old performance available for this question. The table below uses the OECD’s published mean scores and two proficiency measures. “Top performers” means students who reached Level 5 or 6 in at least one of science, reading or mathematics. “Low performers in all three” means students below Level 2 in science, reading and mathematics.
| Education System | Science | Reading | Mathematics | Top Performers | Low Performers in All Three |
|---|---|---|---|---|---|
| B-S-J-Z (China) | 597 | 527 | 612 | 55.5% | 1.8% |
| Singapore | 560 | 535 | 563 | 42.3% | 6.8% |
| Macao (China) | 541 | 501 | 549 | 30.8% | 5.2% |
| Chinese Taipei | 540 | 508 | 546 | 35.0% | 9.1% |
| Japan | 538 | 503 | 525 | 27.1% | 8.8% |
| Estonia | 527 | 499 | 508 | 18.0% | 7.4% |
| Korea | 526 | 501 | 522 | 28.1% | 9.4% |
| United Kingdom | 511 | 494 | 488 | 18.2% | 12.0% |
| Canada* | 510 | 490 | 485 | 17.4% | 12.0% |
| Finland | 504 | 474 | 469 | 14.0% | 15.7% |
| OECD average | 482 | 461 | 463 | 11.9% | 19.7% |
The table shows why Singapore is a defensible answer when “best” means very high current academic performance across the three main PISA subjects. B-S-J-Z (China) posted still higher science and mathematics scores, but it is not a national result for all of China. Japan, Estonia and Korea combine high mean scores with comparatively small shares of students below Level 2 in all three domains. Canada and Finland remain above the OECD averages shown here, yet their trend stories differ from the impression created by older reputation-based rankings. The wider context is less positive: PISA 2025 recorded the lowest OECD-average performance observed so far in science, reading and mathematics. [g]
B-S-J-Z is not a score for all of China
In PISA 2025, B-S-J-Z (China) refers to Beijing, Shanghai, Jiangsu and Zhejiang. Treating that result as a national Chinese average would overstate what the assessment reports. OECD also distinguishes countries from territories and other participating economies in its reporting. [h]
High Scores and Educational Fairness Are Separate Tests
A system can score highly overall while still showing a strong relationship between family background and achievement. PISA therefore reports both inclusion—whether students reach a baseline level—and socio-economic fairness—how much performance varies with students’ economic, social and cultural background.
In the 2025 data, OECD identified B-S-J-Z (China), Canada, Estonia, Ireland, Japan, Korea and Macao (China) as systems that combined above-OECD-average performance with high inclusion and relatively weak socio-economic association with science performance. That does not prove that one policy caused the result. It does show why Estonia, Japan and Korea deserve attention beyond their raw averages, and why Canada can still look strong on fairness even while its national performance trend has weakened. [i]
A country should not be labelled “best” simply because its mean score is high. The distribution of learning matters: who reaches the baseline, who reaches advanced levels, and how strongly background predicts results can change the judgment.
Why Singapore, Japan, Korea and Estonia Stand Out Differently
Singapore: The Clearest Academic-Performance Leader
Singapore’s case rests on breadth rather than one subject. It scored above the OECD average in science, reading and mathematics, and 37% of its students reached Level 5 or 6 in mathematics. The system also led PISA 2025 reading with a mean score of 535 and recorded a computational problem-solving score above the OECD average. The latest trend is not uniformly upward: mathematics and reading were lower than in 2022, while science was broadly unchanged. That distinction matters because a system can be the current leader and still have recent areas of decline. [j]
Japan and Korea: High Averages With Large Advanced-Performance Groups
Japan and Korea sit below Singapore on the 2025 mean scores but remain among the strongest multi-subject performers. Both also have large shares of students reaching advanced levels in at least one core subject, and both appear in the OECD group combining strong performance with relatively favourable socio-economic fairness. This makes them stronger examples of broad academic performance than a ranking based only on one mathematics or science column would suggest.
Estonia: A European Leader With a Small Low-Performance Share
Estonia’s 2025 profile is notable because its science, reading and mathematics scores all sit well above the OECD averages in the published table, while only 7.4% of students were below Level 2 in all three subjects. Its socio-economic performance gap in science was also smaller than the OECD average. Estonia therefore remains a useful case when the comparison values both achievement and how widely baseline learning is distributed. [k]
Reputation Can Lag Behind the Data
Finland: Still Above the OECD Average, but No Longer the Automatic Number-One Answer
Finland remains widely associated with high-performing schooling because of its earlier PISA record and distinctive education model. Current data require a more precise description. In PISA 2025, Finland scored above the OECD average in science, reading and mathematics, yet mathematics and reading were lower than in 2022 and the longer trend extends a decline in mean performance over roughly two decades. Its 2025 mean scores were 504 in science, 474 in reading and 469 in mathematics. Finland is therefore still an above-average performer, but an undated claim that it is simply “the world’s best education system” does not reflect the latest comparative results. [l]
Canada: Strong Relative Outcomes With a Weaker Trend
Canada also illustrates the difference between level and direction. Its students remained above the OECD average in all three main subjects, and its socio-economic gaps were comparatively favourable. Yet the 2025 country note reports lower mathematics and reading results than in 2022, with science broadly unchanged; the three 2025 subject results were the lowest Canada had recorded in PISA. Canada’s estimates also carry an OECD caution because student and school response rates fell below PISA’s minimum targets, and non-response may have produced a small upward bias in national scores. [m]
Improvement Is Not the Same as Being Highest-Ranked
Rankings tend to reward the current level. Trend data answer a different question: which systems are moving in a better direction? Türkiye is a clear example in the 2025 cycle. Its results rose from 2022 in science, reading and mathematics, and the OECD country note places Türkiye among the small group of participants that improved in all three subjects over that period. Its scores did not place it above the leading East Asian systems, but the direction of change is educationally meaningful and should not be erased by a single rank position. [n]
The United Kingdom offers another example. Its 2025 science result rose from 2022, while mathematics and reading were broadly stable, and the UK was among the education systems appearing in the top ten across all three main PISA domains. That does not mean the United Kingdom has one uniform school system: England, Scotland, Wales and Northern Ireland have separate education arrangements. A PISA result reported for the UK should not be used to imply that curriculum, qualifications or school governance are identical across its four nations. [o]
Teacher Capacity Can Change the Long-Term Picture
Student assessments describe outcomes at a point in time. They do not show whether a system has enough qualified teachers to maintain those outcomes. OECD’s 2026 teacher-workforce data report that, on average across OECD countries, 9.1% of primary and secondary teachers were not fully qualified in 2024/25. The distribution is uneven: some systems report very low shares, while others rely more heavily on staff who do not yet meet the standard qualification requirements. OECD also notes that teacher shortages may appear through unfilled posts, non-fully-qualified staff or other staffing pressures, so one vacancy measure cannot describe every country equally well. [p]
This matters for “best system” comparisons because present achievement and future capacity are not the same variable. A country can report strong current learning outcomes while facing recruitment, retention or subject-specific staffing problems that may affect later cohorts.
Access and Completion Matter Beyond the PISA Population
PISA samples 15-year-olds who are still in school and meet its participation definition. That makes it powerful for comparing learning among enrolled students at the same age, but it does not replace measures of who entered school, who remained enrolled, and who completed each stage.
UNESCO’s SDG 4 indicator system separates these issues. It tracks minimum proficiency in reading and mathematics, completion rates for primary through upper secondary education, out-of-school rates and legal guarantees around free and compulsory education. A country comparison that reaches beyond high-income PISA participants should include these measures, especially where school participation and completion vary widely. [q]
Why Spending Alone Cannot Identify the Best System
Education spending matters because teachers, buildings, learning materials, special support, technology and student services require resources. It should not be read as a direct quality score. Countries differ in wages, price levels, demographics, school size, transport needs, the division between public and private spending, and what costs are included in education budgets.
The same caution applies when comparing class size, school hours or teacher pay in isolation. These indicators describe how a system is organised and resourced. They do not demonstrate how effectively students learn without outcome and equity data beside them.
Small Score Differences Do Not Always Create a Real Rank Order
International assessment results are estimates based on samples, not a census of every student. PISA therefore reports standard errors and confidence intervals and provides ranges of possible ranks. When two systems have close mean scores, the data may not support a precise claim that one is definitively fifth and the other sixth. The safer comparison is often to identify a group of systems with similar performance rather than force every participant into an exact ordinal position. [r]
Score tables are not medals tables
A one- or two-point difference can be smaller than the uncertainty around the estimates. Exact rank numbers should only be used when the underlying analysis supports that precision.
A Better Comparison Matrix Than a Single Global Rank
A defensible country comparison can keep the measures separate instead of inventing an arbitrary composite score. The matrix below shows what each question would add to an education-system profile.
| Question | Useful Evidence | What a Strong Result Means |
|---|---|---|
| Do students learn at a high level? | PISA, TIMSS, PIRLS and national assessments | High mean performance in the tested age, grade and subject |
| Does most of the cohort reach a basic standard? | Proficiency-level distributions | A small low-performing share and broad baseline mastery |
| Can the system produce advanced performance? | Top proficiency levels | A sizeable group reaches demanding levels of subject knowledge and reasoning |
| Is performance broadly shared? | Socio-economic gradients and inclusion measures | Family background has a weaker association with achievement while overall performance remains strong |
| Is the direction healthy? | Multi-cycle trend data | Results are stable at a high level or improving without widening low-performance groups |
| Can students access and finish school? | UIS participation, out-of-school and completion indicators | Broad participation and high completion across school stages |
| Can the system staff its schools? | Teacher qualification, vacancy and shortage indicators | Schools can fill posts with appropriately prepared teachers |
| Do students have viable next steps? | Upper-secondary, vocational and higher-education progression data | Academic and vocational routes lead to recognised further study, training or employment options |
This approach also avoids treating educational design as a moral ranking. A more centralised curriculum, a later tracking age, a strong vocational sector, school-based assessment or national examinations can each work differently depending on implementation and context. The comparison should describe the outcome being tested and the trade-offs visible in the data.
Which Systems Stand Out Under Different Definitions?
For current academic performance among 15-year-olds, Singapore is the clearest country-level leader in PISA 2025, while B-S-J-Z (China) recorded higher science and mathematics scores for its four participating jurisdictions. Japan, Korea and Estonia form part of the strongest multi-subject group, with Macao (China), Chinese Taipei and the United Kingdom also appearing near the top across the three main subjects.
For high performance combined with socio-economic fairness, Estonia, Japan and Korea deserve particular attention, while Canada also performs well on the fairness measures despite weaker recent score trends. For improvement, the current leaders are not automatically the most interesting cases; Türkiye, for example, improved across science, reading and mathematics from 2022 to 2025. For system sustainability, teacher supply, access, completion and pathways after school need to sit beside test results.
The most accurate answer is therefore conditional: the “best education system” depends on the outcome being compared. A credible international comparison names that outcome first, uses data that actually measure it, and avoids turning one assessment into a verdict on every part of a country’s schools.
EducationModels.org is an independent informational guide and is not affiliated with any ministry of education, school authority, exam board, university, government agency or official ranking organisation. International datasets, definitions and national education rules can change; decisions that depend on current requirements should be checked with the relevant official authority.
Sources and Verification
- [a] OECD — PISA 2025 Results (Volume I) — Supports the current cross-country PISA 2025 performance context and the group of leading education systems. (OECD is the publisher and administrator of PISA.)
- [b] OECD — What is PISA? — Verifies the age-based PISA population and the purpose of the assessment. (Official OECD methodology page.)
- [c] TIMSS & PIRLS International Study Center — Publication of the TIMSS 2023 International Results — Verifies the TIMSS 2023 grade levels, subjects, participant scale and contextual questionnaires. (Official TIMSS & PIRLS International Study Center.)
- [d] TIMSS & PIRLS International Study Center — PIRLS 2021 International Results in Reading — Verifies the latest released PIRLS international cycle and its reading-achievement coverage. (Official PIRLS publication source.)
- [e] OECD — 2026 Education Indicators, Executive Summary — Verifies the scope of the 2026 OECD indicators and their focus on teacher shortages. (Official OECD publication.)
- [f] UNESCO Institute for Statistics — SDG 4 Indicators — Verifies the SDG 4 measures for proficiency, completion, out-of-school participation and legal education guarantees. (Official UNESCO statistical source.)
- [g] OECD — PISA 2025 Results (Volume I), Executive Summary — Source for the PISA 2025 mean scores, top-performer shares, low-performer shares and short-term changes used in the comparison. (Official OECD PISA report.)
- [h] OECD — PISA 2025 Reader’s Guide — Verifies that B-S-J-Z (China) refers to Beijing, Shanghai, Jiangsu and Zhejiang and explains PISA’s reporting units. (Official OECD reporting guidance.)
- [i] OECD — Student Performance in PISA 2025 — Supports the comparison of achievement, inclusion and socio-economic fairness. (Official OECD PISA analysis chapter.)
- [j] OECD — PISA 2025 Results: Singapore — Verifies Singapore’s subject performance, advanced mathematics share and recent trend. (Official OECD country note.)
- [k] OECD — PISA 2025 Results: Estonia — Supports Estonia’s socio-economic comparison and high-performance profile. (Official OECD country note.)
- [l] OECD — PISA 2025 Results: Finland — Verifies Finland’s 2025 scores, position above OECD averages and long-term downward trend. (Official OECD country note.)
- [m] OECD — PISA 2025 Results: Canada — Verifies Canada’s above-average outcomes, recent decline and PISA 2025 sampling caution. (Official OECD country note.)
- [n] OECD — PISA 2025 Results: Türkiye — Verifies the improvement in science, reading and mathematics between 2022 and 2025. (Official OECD country note.)
- [o] OECD — PISA 2025 Results: United Kingdom — Verifies the UK’s 2025 PISA performance and short-term subject trends. (Official OECD country note.)
- [p] OECD — Teacher Shortages and the Attractiveness of the Teaching Profession — Verifies the 9.1% OECD-average share of non-fully-qualified primary and secondary teachers in 2024/25 and the ways teacher shortages appear in system data. (Official OECD publication.)
- [q] UNESCO Institute for Statistics — UIS Data Browser — Verifies the SDG 4 monitoring categories used for minimum proficiency, completion and out-of-school rates. (Official UNESCO statistical database.)
- [r] OECD — PISA 2025 Technical Notes on Analyses — Verifies the use of standard errors, confidence intervals and rank ranges when interpreting country comparisons. (Official OECD technical documentation.)