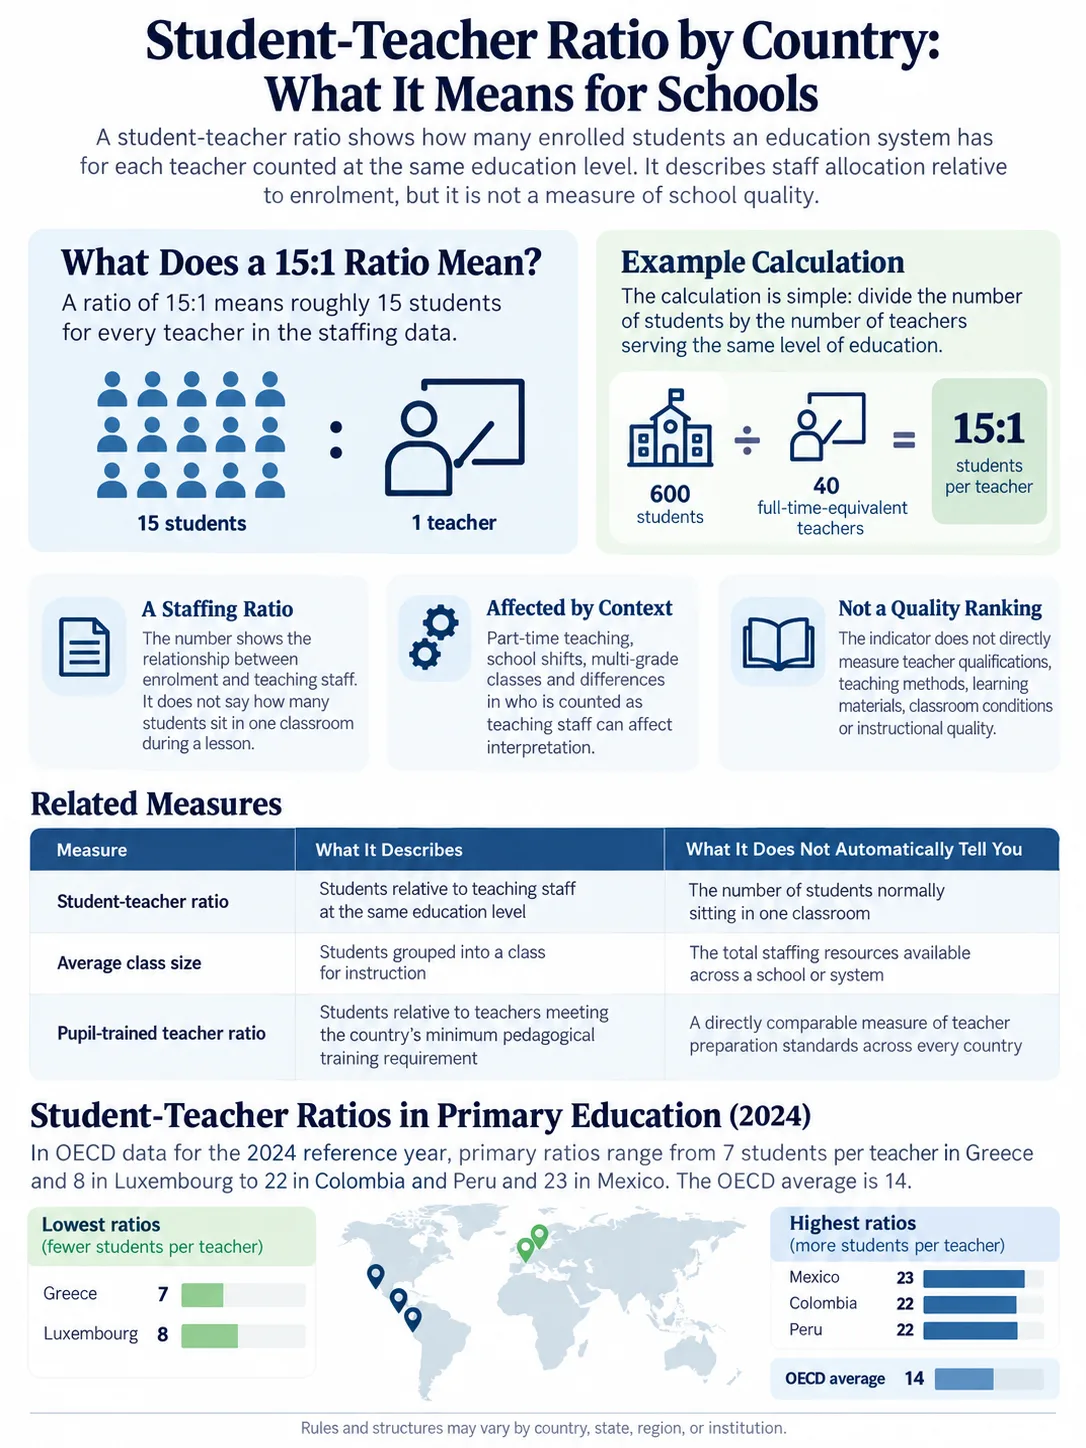
A student-teacher ratio shows how many enrolled students an education system has for each teacher counted at the same education level. A ratio of 15:1 means roughly 15 students for every teacher in the staffing data; it does not mean that the average classroom contains 15 students. In OECD data for the 2024 reference year, primary ratios range from 7 students per teacher in Greece and 8 in Luxembourg to 22 in Colombia and Peru and 23 in Mexico. The OECD average is 14. These numbers reveal how intensively teaching staff are allocated relative to enrolment, but they are not a ranking of school quality.[a]
What a 15:1 Student-Teacher Ratio Actually Means
The basic calculation is simple: divide the number of students by the number of teachers serving the same level of education. A school with 600 students and 40 full-time-equivalent teachers has a ratio of 15 students per teacher.
The Number Is a Staffing Ratio
600 students ÷ 40 full-time-equivalent teachers = 15 students per teacher. The calculation describes the relationship between enrolment and teaching staff. It does not say how many students sit in one classroom during a lesson.
UNESCO UIS defines the pupil-teacher ratio as the average number of pupils per teacher at a specified level of education. Its technical guidance also warns that part-time teaching, school shifts, multi-grade classes and differences in who is counted as teaching staff can affect interpretation. The indicator does not directly measure teacher qualifications, teaching methods, learning materials, classroom conditions or instructional quality.[d]
| Measure | What It Describes | What It Does Not Automatically Tell You |
|---|---|---|
| Student-teacher ratio | Students relative to teaching staff at the same education level | The number of students normally sitting in one classroom |
| Average class size | Students grouped into a class for instruction | The total staffing resources available across a school or system |
| Pupil-trained teacher ratio | Students relative specifically to teachers meeting the country’s minimum pedagogical training requirement | A directly comparable measure of teacher preparation standards across every country |
The third measure needs particular care. UNESCO UIS defines a trained teacher according to the minimum organized pedagogical teacher training required in that country. National training requirements can differ, so a pupil-trained teacher ratio answers a different question from the ordinary pupil-teacher ratio and should not be treated as the same indicator.[f]
Student-Teacher Ratios by Country
The table below uses internationally comparable data reported in Education at a Glance 2026. Most values refer to 2024. India, Indonesia and South Africa use 2023 values in this OECD table. A dash means that a separately reportable value is not available in the table for that level. The figures are rounded ratios expressed as students per teacher.[b]
| Country | Primary | Lower Secondary | Upper Secondary | Reference Year |
|---|---|---|---|---|
| Austria | 12 | 9 | 10 | 2024 |
| Belgium | 12 | 9 | 9 | 2024 |
| Brazil | 22 | 21 | 22 | 2024 |
| Bulgaria | 10 | 9 | 12 | 2024 |
| Chile | 17 | 19 | 18 | 2024 |
| China | 16 | 13 | 14 | 2024 |
| Colombia | 22 | 23 | 23 | 2024 |
| Costa Rica | 11 | 12 | 13 | 2024 |
| Croatia | 11 | 8 | 8 | 2024 |
| Czechia | 18 | 12 | 11 | 2024 |
| Denmark | 12 | 11 | 13 | 2024 |
| Estonia | 12 | 10 | 16 | 2024 |
| Finland | 12 | 9 | 17 | 2024 |
| France | 18 | 15 | 11 | 2024 |
| Germany | 15 | 13 | 12 | 2024 |
| Greece | 7 | 8 | 10 | 2024 |
| Hungary | 11 | 11 | 11 | 2024 |
| India | 27 | 19 | 21 | 2023 |
| Indonesia | 20 | 21 | 20 | 2023 |
| Israel | 15 | 12 | 11 | 2024 |
| Italy | 11 | 10 | 11 | 2024 |
| Japan | 15 | 12 | 11 | 2024 |
| Korea | 16 | 14 | 12 | 2024 |
| Latvia | 13 | 10 | 14 | 2024 |
| Lithuania | 14 | 10 | 10 | 2024 |
| Luxembourg | 8 | 9 | 9 | 2024 |
| Mexico | 23 | 31 | 22 | 2024 |
| Netherlands | 16 | 16 | 16 | 2024 |
| New Zealand | 16 | 17 | 13 | 2024 |
| Norway | 10 | 8 | 10 | 2024 |
| Peru | 22 | 20 | 20 | 2024 |
| Poland | 13 | 10 | 12 | 2024 |
| Portugal | 13 | 10 | 9 | 2024 |
| Saudi Arabia | 14 | 14 | 14 | 2024 |
| Slovak Republic | 14 | 16 | 14 | 2024 |
| South Africa | 26 | 28 | 32 | 2023 |
| Spain | 12 | 11 | 10 | 2024 |
| Sweden | 12 | 11 | 13 | 2024 |
| Switzerland | 15 | 12 | 12 | 2024 |
| Thailand | 15 | 21 | 20 | 2024 |
| Türkiye | 18 | 14 | 11 | 2024 |
| United Kingdom | 20 | 17 | — | 2024 |
| United States | 14 | 14 | 15 | 2024 |
| OECD average | 14 | 13 | 13 | 2024 |
Do Not Turn the Table Into a School-Quality Ranking
A lower ratio means more teaching staff relative to enrolment. It does not by itself show stronger learning outcomes, better teaching, smaller classes, better-qualified teachers or a more effective curriculum. Country position also changes by education level.
The spread is large even among countries using the same international reporting structure. Greece reports 7 primary students per teacher, while Mexico reports 23. At lower secondary level the range among the countries shown becomes wider, from 8 in Croatia, Greece and Norway to 31 in Mexico. This variation reflects differences in enrolment, teacher numbers, school networks, teaching loads and the way education systems organize instruction.
Student-Teacher Ratio Is Not Average Class Size
This distinction changes how country data should be read. A system can employ many teachers relative to its student population without placing only a small number of students in each ordinary class. Teachers may work with several groups, teach specialist subjects, provide special-education support, work one-to-one with students or spend only part of their total working time teaching scheduled classes.
OECD data make the difference visible. In lower secondary education, Japan reports about 12 students per teacher and the United States about 14, yet their average class sizes are about 32 and 21 respectively. Korea and Mexico show the reverse type of contrast: their average lower-secondary classes are relatively close at about 26 and 25 students, while the staffing ratios are 14 students per teacher in Korea and 31 in Mexico. The two indicators are related, but they describe different parts of school organization.[c]
| Country | Lower Secondary Students per Teacher | Average Lower Secondary Class Size |
|---|---|---|
| Croatia | 8 | 18 |
| Japan | 12 | 32 |
| Korea | 14 | 26 |
| United States | 14 | 21 |
| France | 15 | 26 |
| United Kingdom | 17 | 24 |
| Mexico | 31 | 25 |
Similar student-teacher ratios can coexist with very different class sizes, and similar class sizes can coexist with very different staffing ratios.
Why the Ratio Changes Between Primary and Secondary School
A country’s ratio should not be treated as one permanent number. Primary, lower secondary and upper secondary education can require different staffing patterns.
Primary schools often organize much of the day around a general classroom teacher who teaches several subjects to one group. Secondary education usually relies more heavily on subject specialists. Students move between mathematics, languages, sciences, arts, physical education, technical subjects and electives, while teachers may teach several classes or year groups during the same week.
That organization helps explain why a national ratio can move sharply between school stages. Finland, for example, is reported at 12 students per teacher in primary education, 9 in lower secondary and 17 in upper secondary. France moves from 18 in primary to 15 in lower secondary and 11 in upper secondary. Türkiye moves from 18 to 14 to 11. Mexico moves in the other direction between the first two stages, from 23 in primary to 31 in lower secondary before falling to 22 in upper secondary.
These changes should be interpreted through the design of each stage rather than as automatic improvement or deterioration. Subject specialization, vocational programmes, smaller elective groups, support provision, teacher workloads and the size of the school network can all change the denominator even when the broad education system remains stable.
What Pushes a Country’s Ratio Up or Down
A ratio changes whenever the balance between enrolled students and teachers changes. That sounds straightforward, but the same movement can arise from very different situations.
- Teacher recruitment: adding teaching staff while enrolment remains stable lowers the ratio.
- Student population decline: fewer students with the same teaching workforce also lowers the ratio, even though no new teachers were hired.
- Rapid enrolment growth: student numbers can rise faster than teacher recruitment, raising the ratio.
- Teacher retirement or attrition: losing teachers while student numbers remain similar raises the ratio.
- Small rural schools: maintaining schools for dispersed populations can produce low ratios because a minimum staffing level is needed even when enrolment is small.
- School consolidation: merging small schools may change both school size and staff allocation without changing national enrolment very much.
- Specialist and support teaching: staffing for special education, language support or small-group instruction can reduce the system-level ratio without reducing ordinary class size by the same amount.
- Teaching loads: systems differ in how much scheduled classroom teaching each teacher performs, affecting how many staff members are required to deliver the same number of lessons.
This is why a fall from 18 students per teacher to 15 cannot be interpreted correctly until both sides of the calculation are examined. It might reflect an expansion of the teaching workforce, falling enrolment or a combination of the two.
A Lower Ratio Can Help Without Guaranteeing Better Schools
More teachers relative to the number of students can give a school system greater staffing capacity. Schools may have more room for individual support, intervention groups, special-education provision, subject options or smaller instructional groups. A teacher responsible for fewer students across a timetable may also have more opportunity to know individual learning needs and provide feedback.
The ratio still leaves major parts of teaching and learning unmeasured. It does not show whether teachers have strong subject knowledge, whether vacancies are filled by suitably prepared staff, how much instructional time students receive, how well classes are managed, whether learning materials are available, how students are assessed or whether staffing is distributed evenly across regions.
| The Ratio Can Help Describe | The Ratio Cannot Establish by Itself |
|---|---|
| Teaching staff relative to enrolment | Average classroom headcount |
| Changes in staffing intensity over time | Teacher effectiveness |
| Differences between education levels | Student learning outcomes |
| Broad differences in human-resource allocation | Fair distribution of teachers between schools |
| One part of a country’s school-resource picture | Overall education-system quality |
A country with a low national ratio can therefore still contain overcrowded classrooms, hard-to-staff schools or subject shortages. A country with a higher ratio may also organize teacher time differently and achieve smaller classes than the national staffing number would suggest.
Teacher Shortages Can Hide Behind a National Average
Teacher shortages are not always visible in a countrywide student-teacher ratio. A system may have enough teachers in aggregate while struggling to recruit mathematics teachers, science teachers, special-education staff or teachers willing to work in particular rural or remote areas. Another system may currently show a manageable national ratio but face large replacement needs as an older teaching workforce retires.
The scale of the staffing challenge also extends far beyond the countries with high published ratios. UNESCO’s Global Report on Teachers estimates that 44 million additional primary and secondary teachers are needed worldwide to reach universal primary and secondary education by 2030. The report links the shortage to recruitment needs, teacher attrition, training, working conditions and uneven distribution of teachers, rather than to one national ratio alone.[g]
The Teacher-Shortage Paradox
A relatively low national student-teacher ratio does not prove that every school has enough teachers. Shortages can be concentrated by subject, region, school type or qualification level and remain hidden inside a national average.
How International Ratios Are Calculated
International comparison requires more than dividing two raw headcounts. OECD calculations use full-time-equivalent (FTE) students and full-time-equivalent teachers at the same level of education and in comparable types of institutions. Consistent coverage matters: if a category of schools is excluded from teacher data, the students enrolled in those schools must also be excluded from the student count. OECD methodology also distinguishes teaching staff from other personnel who support instruction.[c]
Why Full-Time Equivalent Counts Matter
Suppose a school employs 30 full-time teachers and 20 teachers who each work half time. A simple headcount gives 50 teachers. Converting the part-time positions to full-time equivalents produces 40 FTE teachers instead. With 600 students, the two methods would produce very different apparent ratios:
| Calculation | Teachers Counted | Result for 600 Students |
|---|---|---|
| Raw teacher headcount | 50 | 12.0 students per teacher |
| Full-time-equivalent count | 40 FTE | 15.0 students per teacher |
FTE conversion prevents a system with many part-time teachers from appearing more heavily staffed simply because every employee was counted as one full teacher.
The Education Level Must Match on Both Sides
Primary students should be compared with teachers serving primary education, lower-secondary students with staff serving lower secondary and so on. Mixing stages would distort the indicator. This also explains why country comparisons should preferably use standardized international education levels rather than relying only on local labels such as elementary school, middle school or high school.
Reference Years Matter in Country Comparisons
International databases are updated in releases, but that does not mean every country has supplied a value from the same school year. The UNESCO Institute for Statistics February 2026 education-data refresh incorporated new or updated information from more than 200 countries and territories, including revised national series and newly validated submissions. Availability still differs by indicator and country.[e]
A table that combines each country’s latest available value can therefore contain different reference years. That format is useful for broad global coverage, but it should not be described as though every number represents the same moment. A country with a 2025 value and another with a 2021 value are not being observed under identical timing.
For that reason, the country table on this page uses a largely shared OECD reference year and explicitly identifies the few cases using 2023 data. When broader UNESCO UIS datasets are used, the reference year should remain visible beside the ratio rather than being hidden from the reader.
A Data Release Year Is Not Always the Data Year
A database released or refreshed in 2026 may contain a country’s latest observation from an earlier year. Always distinguish the publication or database release date from the reference year attached to the national value.
What a Ratio Change Means Inside a School
The same change in the ratio can be produced by different staffing situations. Consider a school that begins with 600 students and 40 FTE teachers, producing a ratio of 15:1.
| Scenario | Students | FTE Teachers | Student-Teacher Ratio | What Changed |
|---|---|---|---|---|
| Starting position | 600 | 40 | 15.0 | Baseline |
| Five teachers added | 600 | 45 | 13.3 | Staffing increased |
| Enrolment falls | 500 | 40 | 12.5 | Student population decreased |
| Teachers leave | 600 | 35 | 17.1 | Staffing decreased |
| Enrolment grows | 700 | 40 | 17.5 | Student population increased |
The first two falling-ratio scenarios have different implications. Adding teachers may create new instructional capacity. Falling enrolment may produce the same statistical direction even though the school has not gained a single teacher. A rising ratio can likewise come from teacher losses, growing enrolment or both.
School leaders also have to decide how available staff are used. A lower ratio might support smaller classes, but it could instead fund special-education teaching, intervention groups, language support, elective subjects or other instructional roles. The national ratio alone cannot identify which choice a school has made.
Why Public, Private, Rural and Urban Schools Can Differ
National ratios combine many schools into one number. The actual staffing environment can vary sharply within the same education system.
A small rural school may require several teachers even when each year group contains few students. Its student-teacher ratio can therefore be low despite limited course choice and a small staff overall. A large urban school may serve far more students and organize staffing more efficiently across many classes, producing a higher ratio even though it offers more specialist subjects.
Public and private institutions can also operate under different staffing, funding and timetable arrangements. When sector-specific data are available, comparisons should use the same education level and the same institution category. Mixing a national all-schools ratio from one country with a public-schools-only ratio from another can make the comparison misleading.
Why Falling Enrolment Does Not Automatically End Teacher Shortages
Countries with declining school-age populations may appear likely to need fewer teachers, but national demographics are only one side of staffing demand. Teachers also leave through retirement, career changes and other forms of attrition. Replacement needs can remain high even when enrolment is falling.
The effect is especially uneven when population decline occurs mainly in one region while another region grows, or when teacher shortages are concentrated in a particular subject. A country can therefore record fewer students nationally while still needing new teachers in fast-growing cities, rural schools, special education or hard-to-fill secondary subjects.
This is another reason not to read a falling national ratio as proof that teacher-supply problems have been solved. The ratio tells how many students correspond to each teacher in the aggregate data. It does not show whether the right teachers are available in the places, subjects and school stages where they are needed.
How to Read a Country Ratio Without Misreading the School System
A useful country comparison begins by checking five things: the education level, the reference year, the definition of teaching staff, the institution coverage and whether the number is a student-teacher ratio or a class-size measure. Only then does it make sense to compare countries.
- Match the education level. Primary and secondary staffing patterns can be very different within the same country.
- Check the reference year. “Latest available” does not guarantee that two countries were measured in the same year.
- Look for FTE methodology. Raw teacher headcounts can distort systems with many part-time staff.
- Check institution coverage. Public-only data should not be treated as identical to all-institution data.
- Keep class size separate. Students per teacher and students per class answer different questions.
- Avoid quality labels. A low ratio is a staffing characteristic, not proof of superior teaching or learning.
EducationModels.org is an independent informational guide and is not affiliated with any ministry of education, school authority, exam board, university, government agency or official ranking organization. International indicators are best used as context for understanding education systems. School-level staffing rules, definitions and current national statistics should be checked with the relevant education authority or statistical source when a decision depends on the exact figure.
Reading the Number Without Turning It Into a Ranking
The student-teacher ratio is most useful when it is treated as a measure of staffing intensity. It shows the relationship between enrolled students and teachers, allows changes in staffing resources to be tracked and helps expose differences between education levels and countries.
For a fuller picture of what students experience, the ratio needs to sit beside class size, teacher preparation, vacancies, teaching time, support staffing, school location and the way teachers are assigned to classes. Japan and the United States demonstrate why: similar lower-secondary staffing ratios can coexist with very different class sizes. A single ratio can describe part of a school system accurately without describing the whole system.
Sources and Verification
- [a] Statlink — Provides the Education at a Glance 2026 Chapter D2 tables used for the country ratio comparison. (OECD data download.)
- [b] How do student-teacher ratios and class sizes vary across education levels? — Provides 2024 student-teacher ratios by education level, country notes and the definitions used in Education at a Glance 2026. (OECD.)
- [c] Class size and student-teacher ratios — Supports the distinction between class size and staffing ratios and the explanation that the two measures can produce different country patterns. (OECD.)
- [c] Education at a Glance 2026 Sources, Methodologies and Technical Notes — Documents the definitions, coverage and methodological rules behind the international education indicators. (OECD.)
- [d] Education Indicators — Defines the pupil-teacher ratio, its calculation, interpretation and limitations. (UNESCO Institute for Statistics.)
- [e] UNESCO UIS February 2026 Data Refresh background document — Documents the February 2026 education-data refresh, including newly validated and revised country data. (UNESCO Institute for Statistics.)
- [f] Pupil-trained teacher ratio by education level — Defines the trained-teacher version of the indicator and explains why national training requirements affect comparison. (UNESCO Institute for Statistics.)
- [g] Global report on teachers: addressing teacher shortages and transforming the profession — Supports the estimate that 44 million additional primary and secondary teachers are needed worldwide by 2030 and the discussion of recruitment and retention pressures. (UNESCO.)