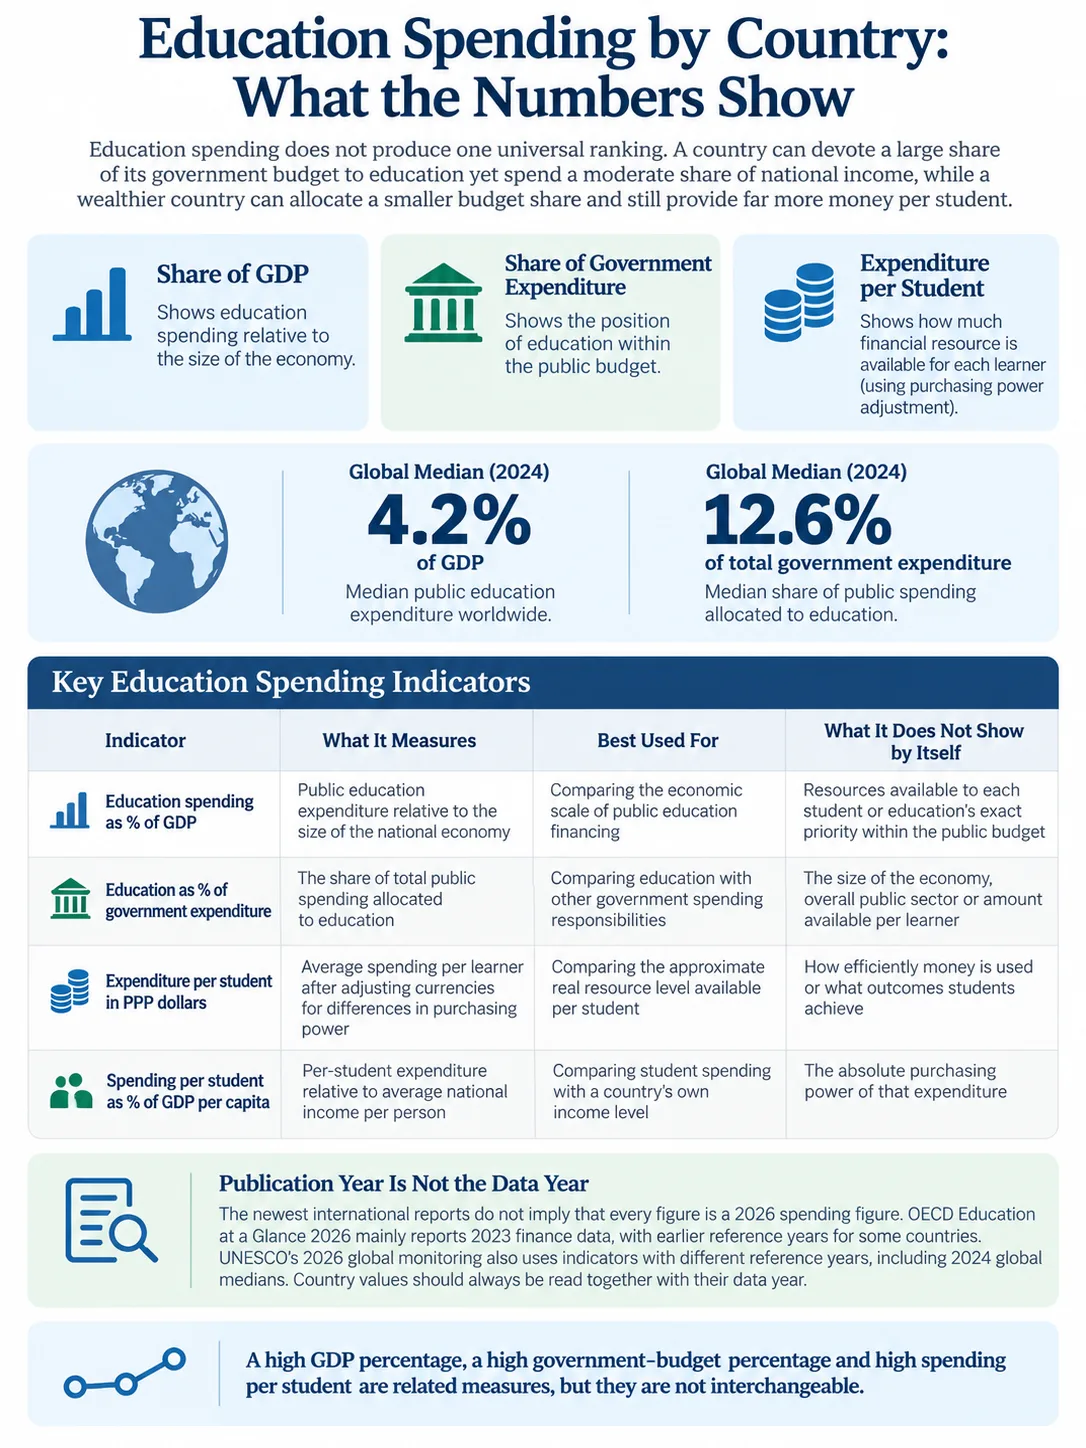
Education spending by country does not produce one universal ranking. A country can devote a large share of its government budget to education yet spend a moderate share of national income, while a wealthier country can allocate a smaller budget share and still provide far more money per student. The latest OECD and UNESCO data make this distinction clear. For cross-country comparison, three measures matter most: education expenditure as a share of GDP, education as a share of total government expenditure, and purchasing-power-adjusted expenditure per student. Each describes a different part of how an education system is financed.
Publication Year Is Not the Data Year
The newest international reports do not imply that every figure is a 2026 spending figure. OECD Education at a Glance 2026 mainly reports 2023 finance data, with earlier reference years for some countries. UNESCO’s 2026 global monitoring also uses indicators with different reference years, including 2024 global medians. Country values should always be read together with their data year.
One Spending Number Cannot Rank Education Systems
Statements such as “Country A spends more on education than Country B” are incomplete unless the measurement is specified. Total spending in national currency favors larger economies. Spending as a percentage of GDP measures education relative to the size of the economy. Education’s share of government expenditure measures its position within the public budget. Spending per student asks how much financial resource is available for each learner.
| Indicator | What It Measures | Best Used For | What It Does Not Show by Itself |
|---|---|---|---|
| Education spending as % of GDP | Public education expenditure relative to the size of the national economy | Comparing the economic scale of public education financing | Resources available to each student or education’s exact priority within the public budget |
| Education as % of government expenditure | The share of total public spending allocated to education | Comparing education with other government spending responsibilities | The size of the economy, overall public sector or amount available per learner |
| Expenditure per student in PPP dollars | Average spending per learner after adjusting currencies for differences in purchasing power | Comparing the approximate real resource level available per student | How efficiently money is used or what outcomes students achieve |
| Spending per student as % of GDP per capita | Per-student expenditure relative to average national income per person | Comparing student spending with a country’s own income level | The absolute purchasing power of that expenditure |
The UNESCO Institute for Statistics defines government education expenditure as a share of GDP as current and capital public expenditure on education divided by GDP for the same financial year. UIS separately identifies education expenditure as a percentage of total government expenditure, because that indicator answers a different question: how education compares with other areas of public spending.
A high GDP percentage, a high government-budget percentage and high spending per student are related measures, but they are not interchangeable.
What the Latest Global Figures Show
UNESCO’s 2026 monitoring of SDG 4 reports that the median public education expenditure in 2024 was 4.2% of GDP. The corresponding median share of total public expenditure was 12.6%. Both measures were lower than their 2010 medians: 4.3% of GDP and 14.4% of public expenditure.
| Global Finance Indicator | Latest UNESCO Figure | Earlier Comparison |
|---|---|---|
| Median public education spending as % of GDP | 4.2% in 2024 | 4.3% in 2010 |
| Median education share of public expenditure | 12.6% in 2024 | 14.4% in 2010 |
| Countries meeting both minimum finance benchmarks | 41 of 183 countries with data | 22% of countries with available data |
The international financing reference points commonly used for education are at least 4% of GDP and at least 15% of total public expenditure. UNESCO reports that only 41 of 183 countries with data met both lower thresholds. That is 22% of the countries covered.
Meeting One Benchmark Is Not the Same as Meeting Both
A country may spend at least 4% of GDP on education but allocate less than 15% of its public budget to the sector. Another may devote a large portion of government spending to education while remaining below 4% of GDP. The two indicators should be checked separately before describing a country’s financing position.
Chile and France Show Why the Two Percentages Can Reverse the Comparison
OECD data for 2023 provide a clear example of why education’s share of government expenditure cannot be treated as another version of its GDP share. Chile allocated 15.6% of total government expenditure to education, equal to 4.4% of GDP. France allocated only 8.1% of government expenditure to education, yet this represented 4.6% of GDP.
| Country / Group | Education as % of Government Expenditure | Government Education Spending as % of GDP | What the Comparison Shows |
|---|---|---|---|
| Chile | 15.6% | 4.4% | Very high education share within the government budget, but a more moderate GDP share |
| France | 8.1% | 4.6% | Lower budget share than Chile, but a slightly higher GDP share |
| OECD average | 9.8% | 4.2% | Reference point across OECD countries for 2023 |
The difference reflects the size and composition of the wider public sector. If total government expenditure forms a large share of the economy, education can represent a relatively modest portion of the government budget and still amount to a sizeable percentage of GDP. Where the public sector is smaller, education may occupy a much larger part of government expenditure without producing an equally high GDP ratio.
OECD’s 2023 comparison placed Belgium, Denmark, Iceland, Israel, Norway and Sweden among countries combining roughly 10% or more of government expenditure for education with more than 5% of GDP. Austria, France and Germany illustrate another pattern: education took less than 9% of government expenditure while public education spending remained around 4% of GDP or higher.
These patterns make a single “highest education spender” label misleading. The answer changes according to whether the comparison concerns budget priority, national economic effort or resources available per student.
Spending per Student Rearranges the Country Comparison Again
GDP ratios become more informative when they are paired with per-student expenditure. Two countries can devote similar proportions of national income to education and still provide very different amounts for each student. National income levels matter, but so do enrolment, age structure and the number of learners sharing the education budget.
OECD converts country expenditure into equivalent U.S. dollars using purchasing power parities (PPPs). PPP conversion reduces distortions caused by market exchange rates and differences in national price levels. It does not make education systems identical, but it provides a more useful cross-country monetary comparison than converting every national budget at ordinary exchange rates.
| Country | Government Expenditure per Student | Reference |
|---|---|---|
| Luxembourg | USD 32,832 PPP | Primary to tertiary, 2023 |
| Norway | USD 21,791 PPP | Primary to tertiary, 2023 |
| Sweden | USD 17,694 PPP | Primary to tertiary, 2023 |
| Netherlands | USD 16,949 PPP | Primary to tertiary, 2023 |
| Germany | USD 16,127 PPP | Primary to tertiary, 2023 |
| United States | USD 15,699 PPP | Primary to tertiary; U.S. reference year 2022 |
| France | USD 13,787 PPP | Primary to tertiary, 2023 |
| OECD average | USD 13,601 PPP | Primary to tertiary, 2023 |
| United Kingdom | USD 12,363 PPP | Primary to tertiary, 2023 |
| Türkiye | USD 5,314 PPP | Primary to tertiary, 2023 |
| China | USD 4,407 PPP | Primary to tertiary, 2023 |
| Peru | USD 1,858 PPP | Primary to tertiary; reference year 2022 |
The table uses government expenditure per full-time-equivalent student across primary to tertiary education from OECD’s 2026 finance tables. Tertiary calculations can include research and development expenditure, and OECD applies country notes where coverage differs. The purpose of the comparison is therefore to show the scale of the resource gap, not to create a league table of education quality.
Across the OECD comparison, government expenditure per student varied by roughly a factor of ten, from about USD 3,400 to more than USD 32,800 in PPP terms. The range is much wider than the spread in education expenditure as a percentage of GDP. This is one reason a GDP-only country ranking can hide large differences in the amount educational institutions can actually spend per learner.
National Income and Student Population Change What the Same GDP Share Can Buy
Imagine two countries that both devote 4.5% of GDP to public education. The percentage alone does not reveal how much reaches the average student. A higher-income economy generates a larger monetary amount from the same GDP share. A country with a larger school-age population must also distribute its education resources across more learners.
Same GDP share + different national income + different student population = different expenditure per student.
UIS therefore also reports expenditure per student as a percentage of GDP per capita. This measure places student expenditure against the country’s own income level. It answers a different question from PPP spending: how large is the average investment in one student relative to average national income?
The two measures work best together. PPP expenditure gives a sense of the resources that spending can purchase. Expenditure relative to GDP per capita shows the effort relative to national income. A lower-income country can make a relatively large financial effort while still having fewer absolute resources available for each learner.
The Global Resource Gap Is Much Larger Than Percentage Rankings Suggest
Differences between income groups show why percentage-of-GDP comparisons need an absolute-resource measure beside them. UNESCO reports annual public spending of about US$55 per learner in low-income countries, compared with more than US$8,500 per learner in high-income countries. Those figures are not interchangeable with the OECD PPP table because the datasets and country coverage differ, but they expose the scale of the global financing gap.
This also explains why describing a country as a “low spender” solely because of its GDP share can be imprecise. A country’s fiscal capacity, demographic profile and spending needs affect how much money a given percentage produces. Conversely, a high GDP share does not guarantee that schools have resources comparable with those in much wealthier economies.
Government Spending Is Only Part of the Education Bill
Most education finance comparisons focus on public spending because government data are more consistently available. Education systems can also receive money from households, companies, international organizations and other non-government sources. The balance changes by country and by education level.
OECD data show that public sources remain the main source of education finance across member countries, but private funding becomes more prominent in tertiary education. In 2023, governments financed about 70% of expenditure in tertiary institutions on average across OECD countries. Government sources accounted for more than 85% in Austria, Finland, Iceland, Luxembourg and Norway, reaching 94% in Norway.
The pattern differs elsewhere. OECD reports that private sources provided at least half of tertiary expenditure in Australia, Israel and the United Kingdom. The United Kingdom recorded a private share of 55%, while Israel recorded 54%. Tuition arrangements, household payments, international student fees and the organization of tertiary institutions can therefore produce very different financing mixes even when total expenditure appears similar.
At the global level, UNESCO estimates that households account for about one quarter of total education expenditure. The household burden is not evenly distributed across income groups. Public expenditure figures should therefore not be read as the complete cost of education to society or to families.
Where the Money Goes Also Changes the Meaning of the Total
A country’s education budget is not a single type of expense. It can finance teaching and non-teaching staff, school buildings, maintenance, instructional materials, administration, student support, meals, transport, equipment, digital services and other operating costs. At tertiary level, some international expenditure measures also include research and development.
Across OECD countries in 2023, an average of 66% of expenditure in educational institutions from primary through tertiary education went to staff compensation. Other current expenditure accounted for 24%, and capital expenditure accounted for 9%. Belgium recorded the highest staff-compensation share in the OECD table at 79%.
A larger staff share does not automatically mean teachers receive higher individual salaries. The percentage also depends on the number of staff, occupational mix, staffing ratios and the amount spent on other services. Likewise, a temporarily high capital share may reflect a building programme or infrastructure cycle rather than a permanent feature of the system.
Primary, Secondary and Tertiary Spending Should Not Be Treated as One Cost Structure
Average spending across all education levels can hide large internal differences. Primary education has one staffing and facility structure; secondary education may require more subject specialization; vocational programmes can require workshops, laboratories and technical equipment; universities may combine teaching with research.
OECD data show that vocational upper-secondary programmes often cost more per student than general programmes. The pattern is not universal, but equipment, specialist facilities and programme organization can raise costs. Tertiary comparisons require another caution because expenditure may include research and development, which can make university spending look much higher than expenditure devoted solely to teaching.
Check the Education Level Before Comparing Countries
A primary-school expenditure figure should not be compared directly with a tertiary figure. A national average can also conceal very different allocations across primary, secondary, vocational and higher education.
Education Spending Has Not Moved in the Same Direction Everywhere
OECD’s longer comparison shows relative stability in the average combined with noticeable country movement. Government education expenditure across OECD countries declined from 4.4% of GDP in 2015 to 4.2% in 2023. That small average change does not mean every country followed the same path.
Chile and Czechia increased public education spending by about 0.5 percentage points of GDP between 2015 and 2023. Brazil, Bulgaria, Costa Rica, Ireland, Latvia and Mexico recorded notable declines in the OECD comparison. Bulgaria showed the largest listed decline, moving from 5.7% of GDP in 2015 to 3.3% in 2023.
The endpoints need careful interpretation. A falling GDP share can occur even while education expenditure rises in monetary terms if GDP grows faster. A rising share can partly result from slower economic growth or a fall in GDP. Percentage-point movement should therefore be checked against real expenditure, enrolment and economic conditions before being described as a budget increase or cut.
Why the Latest Country Figures Do Not All Come From the Same Year
International education finance datasets depend on national reporting. Fiscal years differ. Governments finalize accounts on different schedules. Statistical agencies may revise GDP or expenditure data. Some countries provide information through the joint UNESCO-OECD-Eurostat collection, while UIS receives data from national authorities for wider global coverage.
For OECD Education at a Glance 2026, the main finance reference year is 2023, but the tables identify exceptions. The United States and Peru, for example, have 2022 reference-year notes for some expenditure measures. A country table that silently places such values under a “2026” heading would confuse the report’s publication year with the year in which the spending occurred.
Global UIS comparisons face an additional coverage issue. Not every country reports every indicator every year. A table of “latest available values” can therefore combine different reference years. This does not make the data unusable, but the year should remain visible beside the country value.
Do Not Treat Missing Data as Zero Spending
A blank country value usually means the required comparable observation is unavailable for that table or year. It does not mean the country spent nothing on education.
Budgeted Education Spending and Actual Spending Are Different Measures
An announced education budget records what a government plans or authorizes to spend. Actual expenditure records what was eventually spent. The two can differ because of implementation delays, revised appropriations, revenue changes, procurement timing or projects that move between financial years.
The UNESCO Institute for Statistics Repository of Education Expenditure Reports collects national documents covering both actual and budgeted expenditure. The repository contains education finance material from more than 100 countries covering years from 2010 to 2025 and is updated as additional material becomes available.
For international country comparisons, actual expenditure is generally the stronger measure when comparable final data exist. Mixing a planned budget for one country with executed expenditure for another can create a difference that reflects accounting stage rather than education financing itself.
International Benchmarks Describe Financing Effort, Not Education Quality
Education finance indicators are inputs. They measure money devoted to education, not the quality of teaching, student learning, completion, equity or the efficiency with which funds are used. A country above the 4% GDP benchmark should not automatically be described as having a better education system than a country below it.
Higher expenditure can support smaller classes, teacher compensation, student services, infrastructure, specialist programmes or wider access. Outcomes still depend on how resources are allocated, the costs faced by the system, teacher supply, student needs, governance arrangements and many other characteristics. The relationship between expenditure and results is therefore not a simple spending-to-score conversion.
The same caution applies to international assessments. A test result and an expenditure statistic measure different things. Spending data can help explain the resource environment in which an education system operates, but they cannot independently establish whether that system is effective, equitable or well managed.
Fiscal Pressure Can Limit What a Country Can Allocate to Education
Education budgets compete with other public obligations, and that constraint differs sharply across countries. UNESCO reported in 2026 that 113 countries, home to about 6.1 billion people, were spending more on debt servicing than on education. It also estimated a US$97 billion annual education financing gap for low- and lower-middle-income countries in relation to their national SDG 4 targets.
International assistance is another part of the financing picture for some systems. UNESCO’s 2026 monitoring reported an 8% fall in education aid between 2023 and 2024 under the measures used in the report, while aid to basic education fell more sharply. These flows are much less important in many high-income systems but can matter materially where domestic fiscal capacity is limited.
Such constraints help explain why similar policy goals can be backed by very different resource levels. They should not be used to label one country as valuing education more or less than another. The available fiscal base and competing obligations are part of the comparison.
What the Country Numbers Show When Read Together
Several patterns become visible when the indicators are kept separate. First, education spending as a share of GDP varies less across many OECD systems than spending per student. Similar relative economic effort can therefore coexist with very different school-level resources.
Second, the government-budget measure can reverse an apparent country comparison. Chile’s 2023 data show much higher education priority within total government spending than France, yet France’s education expenditure represents a slightly larger share of GDP. Neither percentage replaces the other.
Third, per-student spending exposes differences that GDP shares hide. OECD government expenditure ranges from only a few thousand PPP dollars per student in some systems to more than USD 30,000 in others. At the global income-group level, UNESCO reports an even wider divide in annual resources per learner.
Fourth, public expenditure does not always represent the full cost of education. Household and other private contributions can be especially important in tertiary education, so countries with similar public figures may rely on very different funding arrangements.
For a country comparison to be meaningful, the value should therefore be read with five pieces of information: the indicator definition, reference year, education levels covered, funding sources included and whether the value is an aggregate percentage or a per-student amount. Without that context, a neat ranking can give a less accurate picture than the underlying data.
EducationModels.org is an independent informational guide and is not affiliated with any ministry of education, school authority, exam board, university, government agency or official ranking organization. International finance datasets are revised as countries submit or update information, so country-specific decisions or formal statistical use should rely on the latest release from the relevant national authority, OECD or UNESCO UIS.
Sources and Verification
- OECD — Key system-level indicators of education finance: Education at a Glance 2026 — Provides the 2023 OECD finance indicators, country examples, per-student PPP expenditure, funding-source data, expenditure composition and 2015–2023 trends.
- UNESCO Global Education Monitoring Report — Monitoring education in the SDGs — Provides the 2024 global education-finance medians, benchmark coverage, household expenditure share and international aid figures used in the global comparison.
- UNESCO Institute for Statistics — Government expenditure on education as % of GDP — Defines the GDP-based public education expenditure indicator, its calculation, reporting basis and Education 2030 financing benchmark.
- UNESCO Institute for Statistics — Methodology — Explains the distinction between GDP share, government-expenditure share, PPP spending per student and spending per student relative to GDP per capita.
- UNESCO Institute for Statistics — Repository of Education Expenditure Reports — Provides national documentation for actual and budgeted education expenditure and explains the repository’s country and year coverage.
- UNESCO — What you need to know about education financing — Supports the comparison of per-learner resources across income groups and the estimate of the education financing gap in lower-income economies.
- UNESCO — Transforming Education Summit: 113 countries spend more on debt servicing than on education — Supports the 2026 figures on debt-servicing pressure, the population covered by those countries and projected pressure on international education aid.